User Manual
This is the user manual for the AutoPIA software. It has a goal-oriented structure, therefore sections correspond to the main goals that a user would like to perform with the software.
Contents
[hide]Open a file
Open a file is a very basic operation that is performed, like in the vast majority of desktop applications, with the menu File|Open. As an alternative, it is possible to use the toolbar open button.
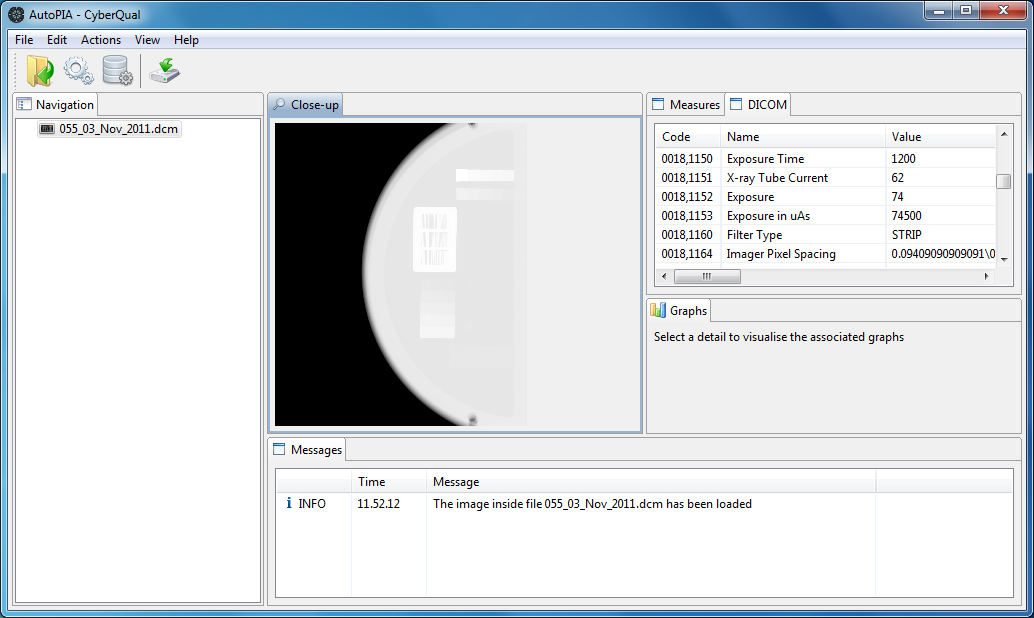
AutoPIA supports the following file formats TIFF, GIF, JPEG, PNG, DICOM, BMP, PGM and FITS. DICOM is the preferred one, because it has been specifically designed for medical images and because it contains lot of useful information about the image itself and the acquisition process (e.g. exposure conditions).
When the image is loaded, it is visualized inside the Close-up view, and if the image is a DICOM one, all DICOM headers are visualised in the DICOM tab on the right.
Analyse the image
The image analysis is automatic and the only action requested to the user is the selection of the phantom type.
In order to start the the analysis it is possible to use the menu Actions | Analyse or click on the analyse button on the toolbar.
If it is possible to select among different phantoms, the following dialog appears.
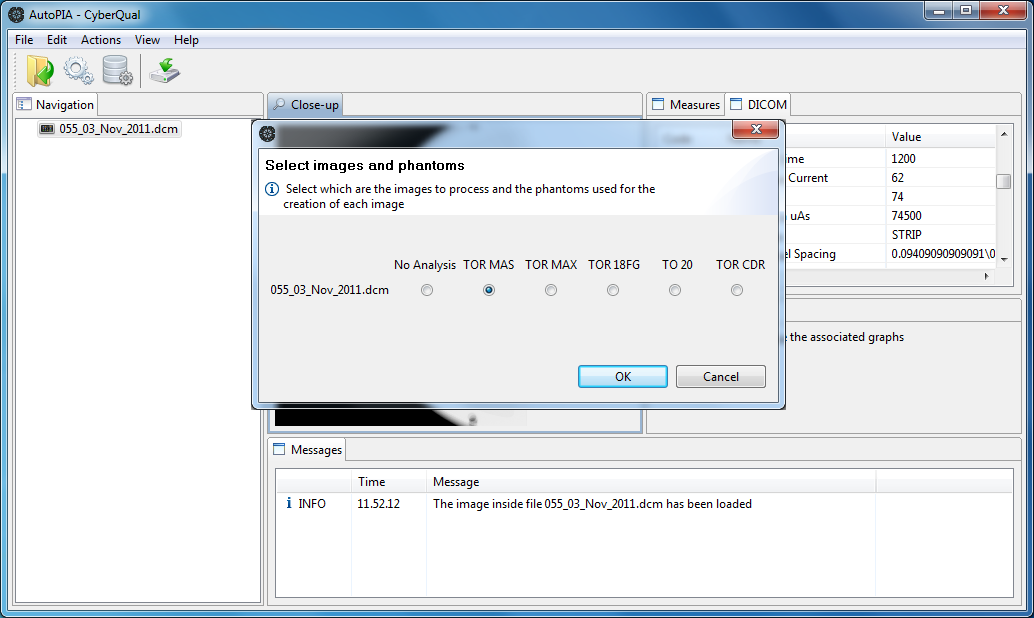
This allows the user to select which is the phantom that generates the
image. If the license allows only one phantom, this window will not
appear and AutoPIA will assume that the image has been generated with
the phantom.
Select the right phantom and click on Ok. AutoPIA will start the image analysis while showing a progress bar. Just under the progress bar there is a Cancel button that can be used to interrupt the analysis. The analysis lasts for a while depending on the image features. Normally it never lasts more than 1 minute, but in certain circumstances it could last something more (seldom it reaches two minutes).
When the analysis is completed, the results are presented.
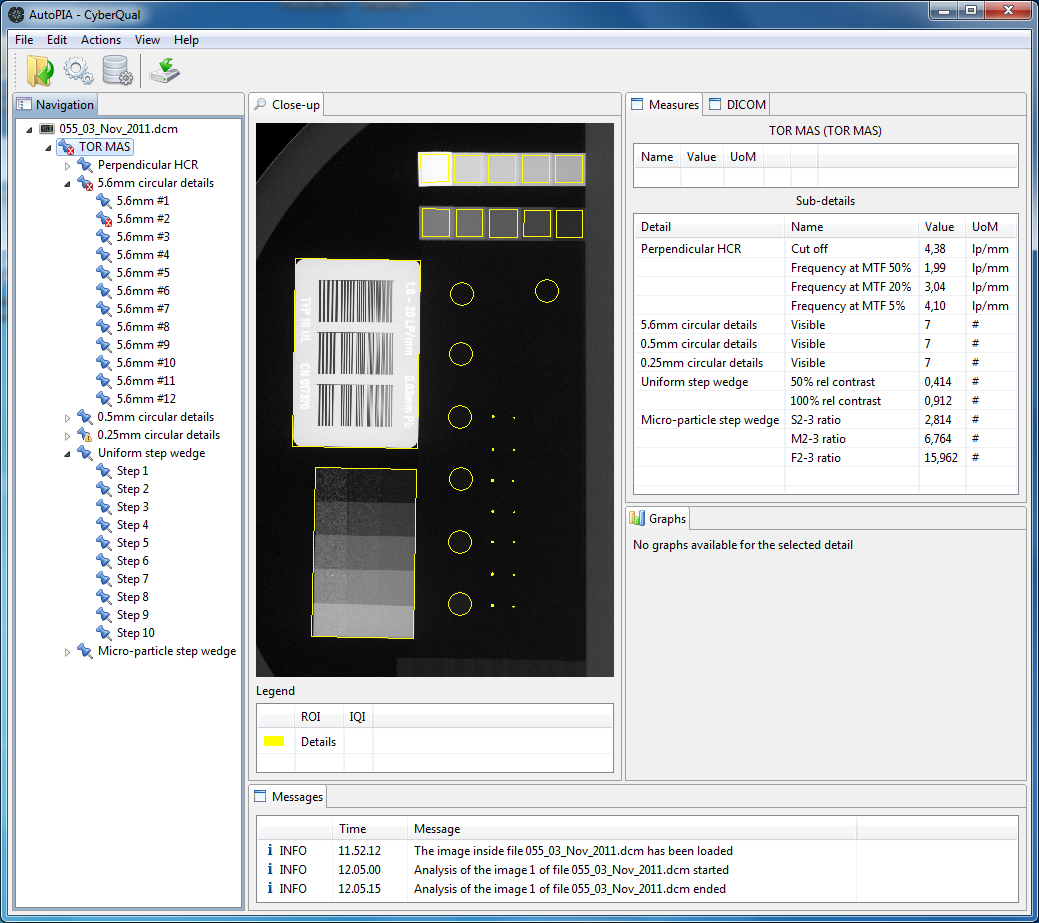
The result of the analysis contains lot of information, especially for
phantoms containing lot of details. In order to allow an easy and
efficient navigation through results, they are structured in
hierarchical fashion, which is represented on the left, inside the view
called navigation. Every node of the tree corresponds to a detail (or
collection of details) and when selected, its features are shown in the
other views of the working area:
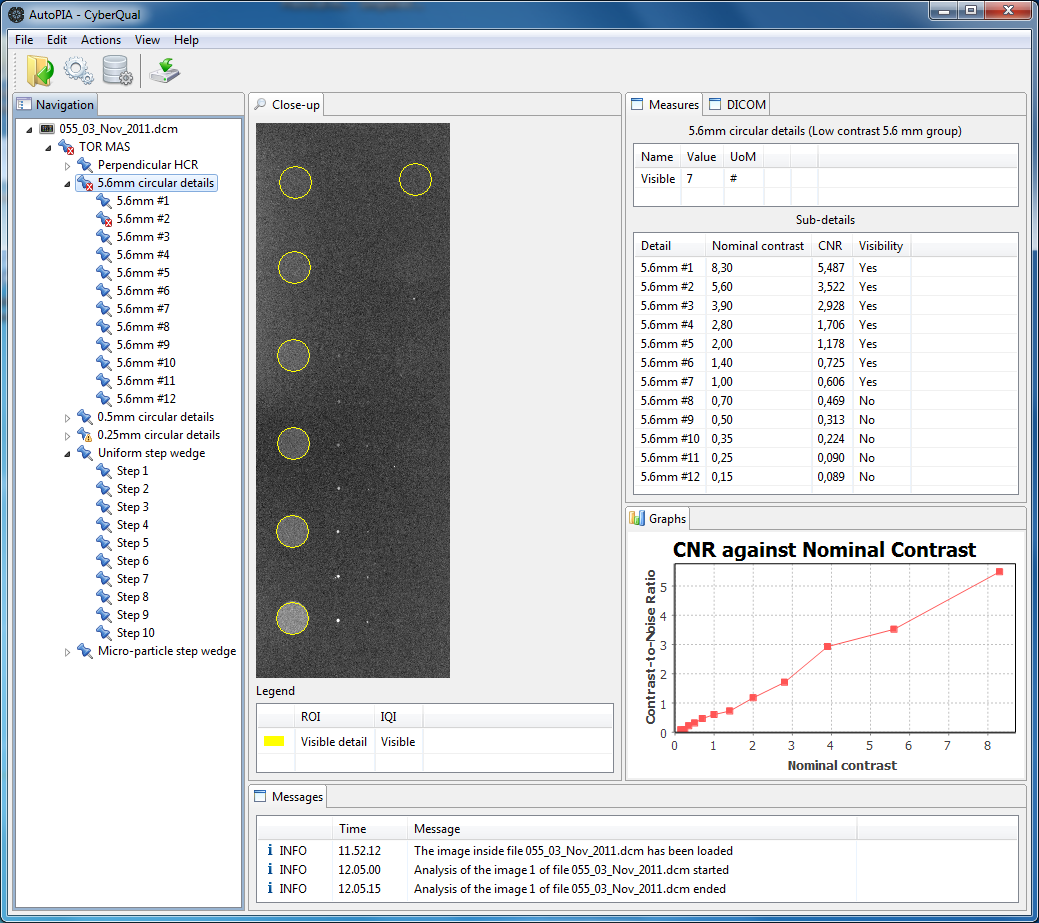
- the region of the image containing the detail is shown in the Close-up view
- the detail image quality indices are listed inside the Working_area_measures|Measures view: the first table contains the IQIs of the detail, while the second table lists the IQIs of the sub-details (if any)
- if available, graphs are shown in the Graphs view
Export results data
The results of the analysis can be exported in a file with CSV (Comma Separated Values) format. This allows result data manipulation with other tools like spreadsheets or database. This way every user can manipulate the analysis results the way they prefer and with the tools they prefer.
The operation is very simple and can be performed using the menu File|Export to CSV or the toolbar export button. A standard Save window appears, like the one used by all standredm applications, and the user can select the name of the file and the directory where to save it.
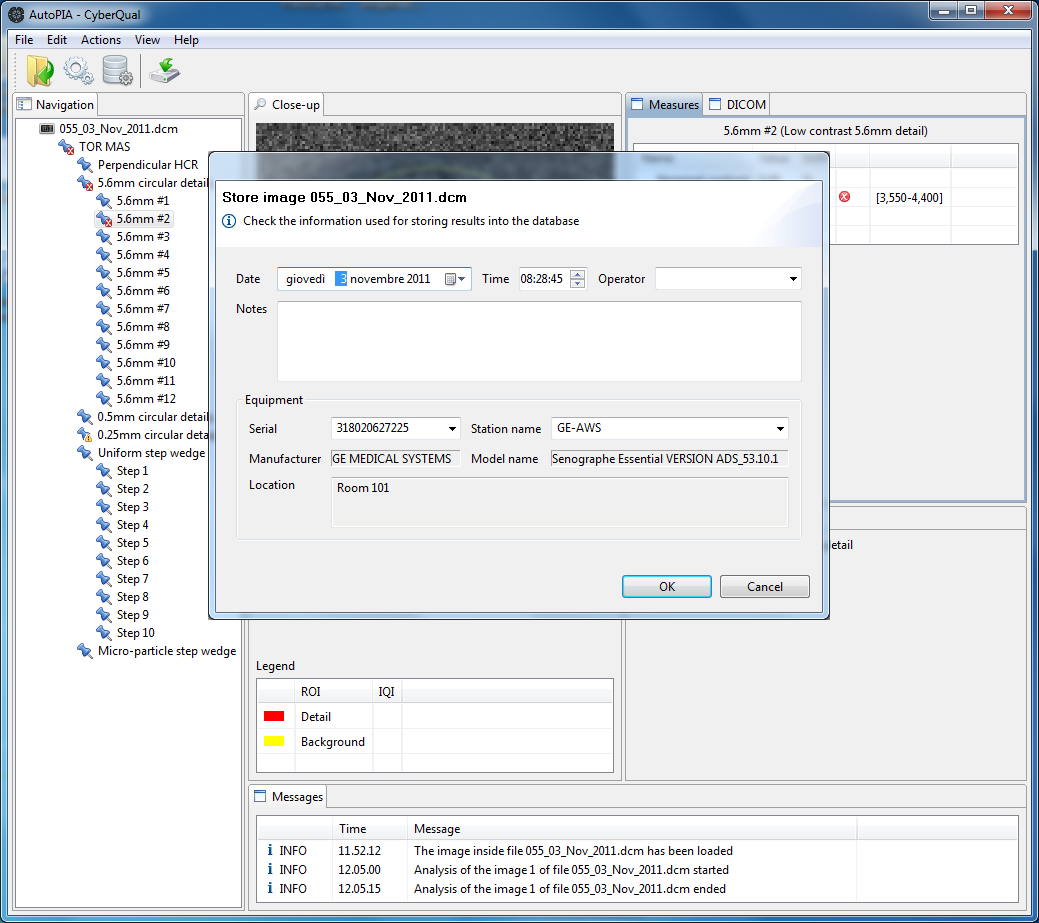
Store analysis data
'Only available with control charts option' AutoPIA contains a DBMS (DataBase Management System) in order to store the analysis results. This allows AutoPIA to visualize an IQI (Image Quality Index) over time and thus to give users a clear picture of the IQI trend. Store analysis data into the database is very simple: it is possible to use the menu Actions|Store or the toolbar store button.
AutoPIA digs inside data associated to the image (like DICOM headers) in order to retrieve all information needed to store the results. For example, the serial number of the equipment under test, the date of the image, the exposure conditions. Sometimes the information is not availble and shall be entered manually (for example using the CR modality), sometimes everything is ready and the user is just requested to check data and confirm the operation.
Check control charts
'Only available with control charts option' Control charts represent the trend of a statistic inside the range of working values. Control charts are used to visualise the statistic over time and thus to have a clear diea of which are the trends. Furthermore, control charts have also a baseline vale, which is the "normal" value for the statistic and one ore more threshold limiting the working range for the statistic.
AutoPIA provides control charts for all the IQIs (Image Quality Indices) calculated during the analysis. They are visualized using the menu View|Results layout. The application layout chenges completely and appears like this picture.
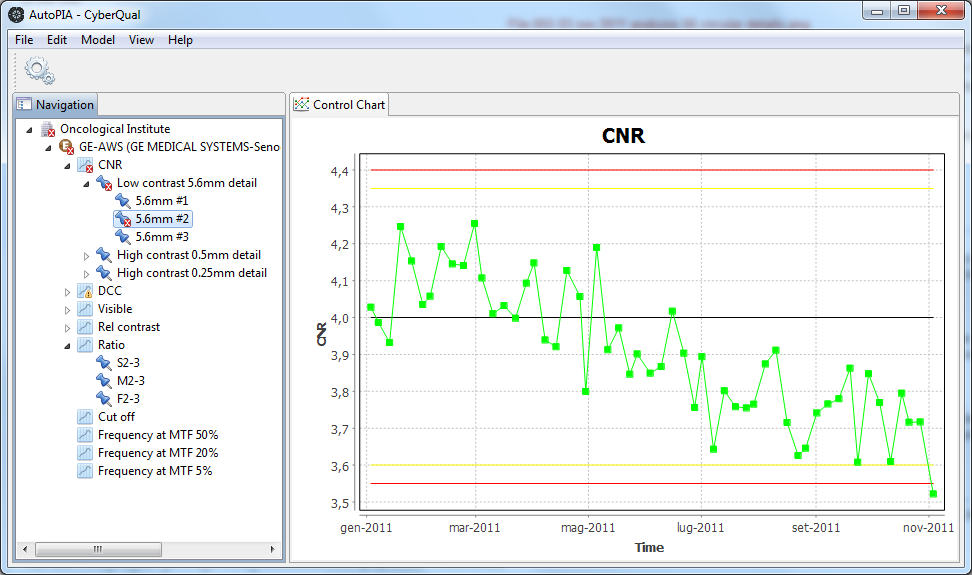
Every analysis result contains lot of IQIs, so there are lot of control
charts that can be visualized. In order to give users a fast access to
every control chart, in the Navigation view on the left, there is a tree
for navigate through control charts. Hierarchy starts with the medical
centres, then there are all the equipments inside the medical centre,
then the test objects used for the equipment (if more than one) and then
the detail hierarchy inside the test object. This structure is the same
one used for the analysis. Every node representing a detail for which
an IQI has been calculated during analysis, has an associated control
chart.